


+12.4%

Revenue lift in branches with knowledge scores above 80%.
KNOWLEDGE SCORE × REVENUE

Completion rates tell you who finished. Lemonade's analytics tell you who learned, what they retained, and how it changed their performance.
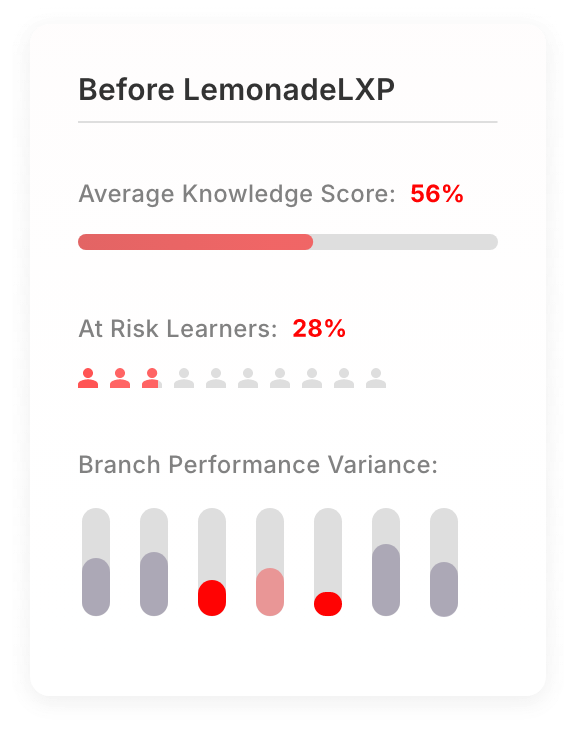

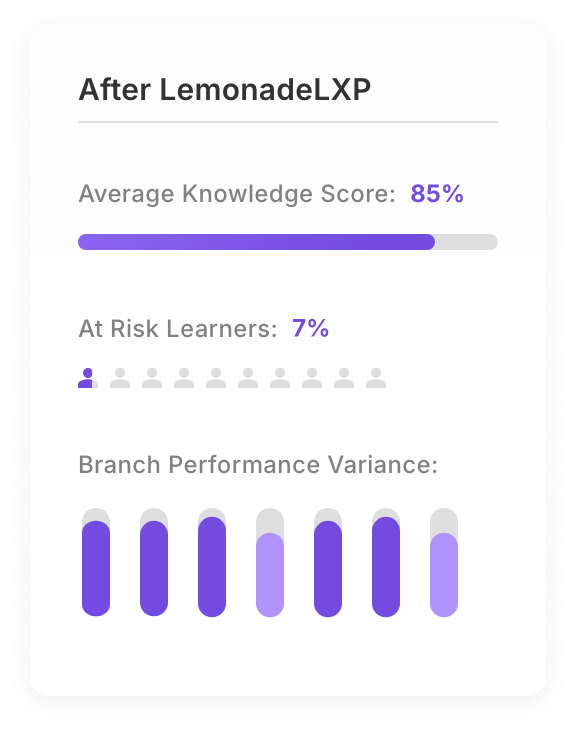
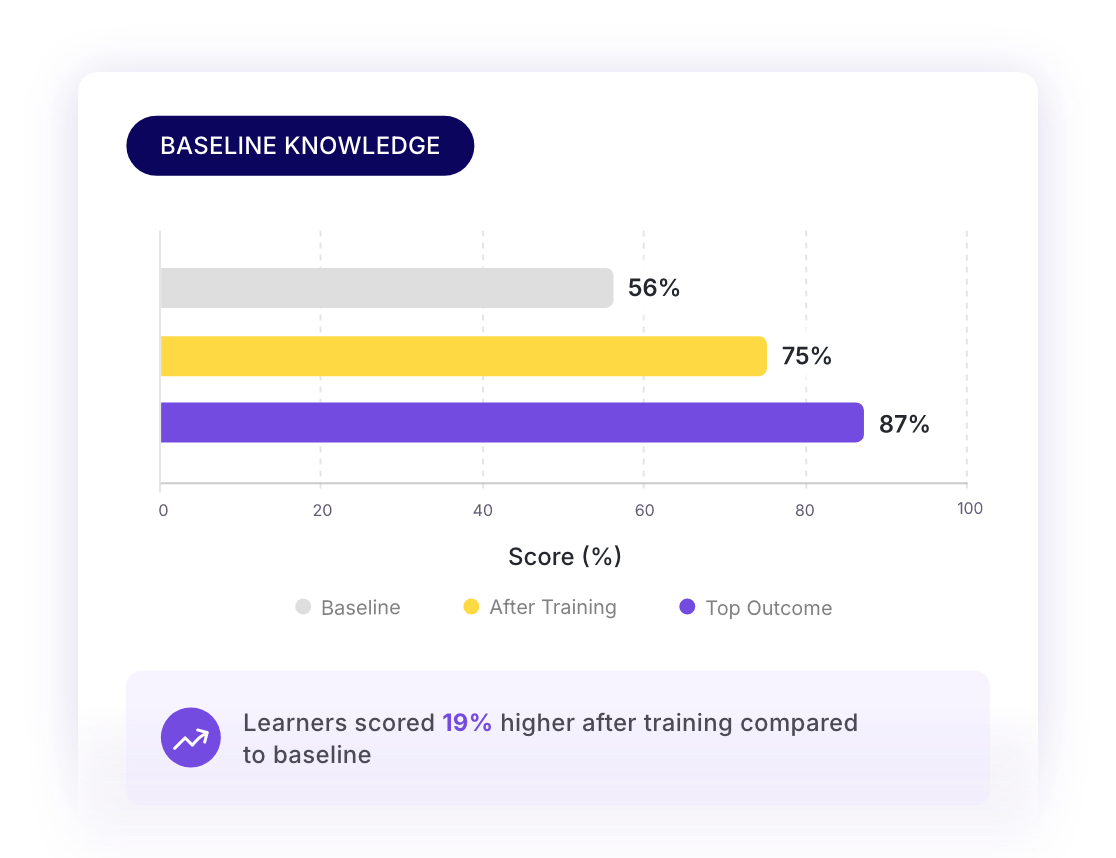
See how employees perform before and after training. Measure actual knowledge change.
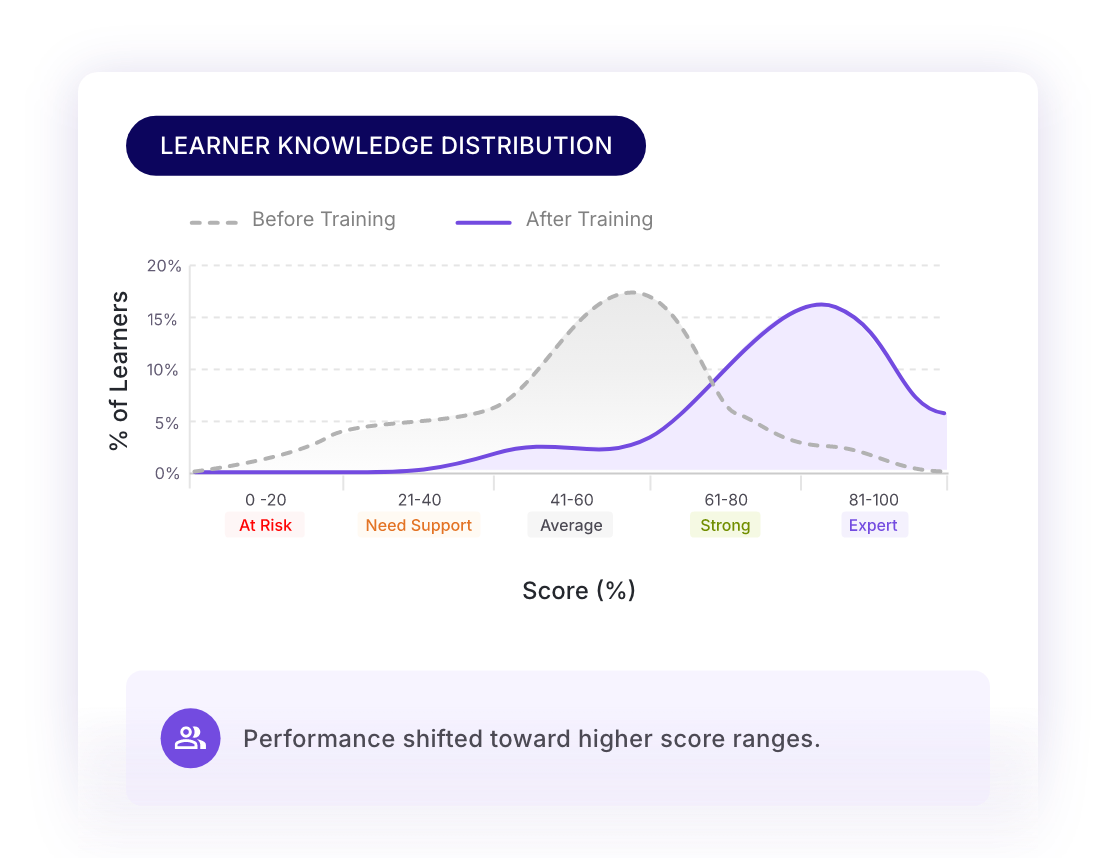
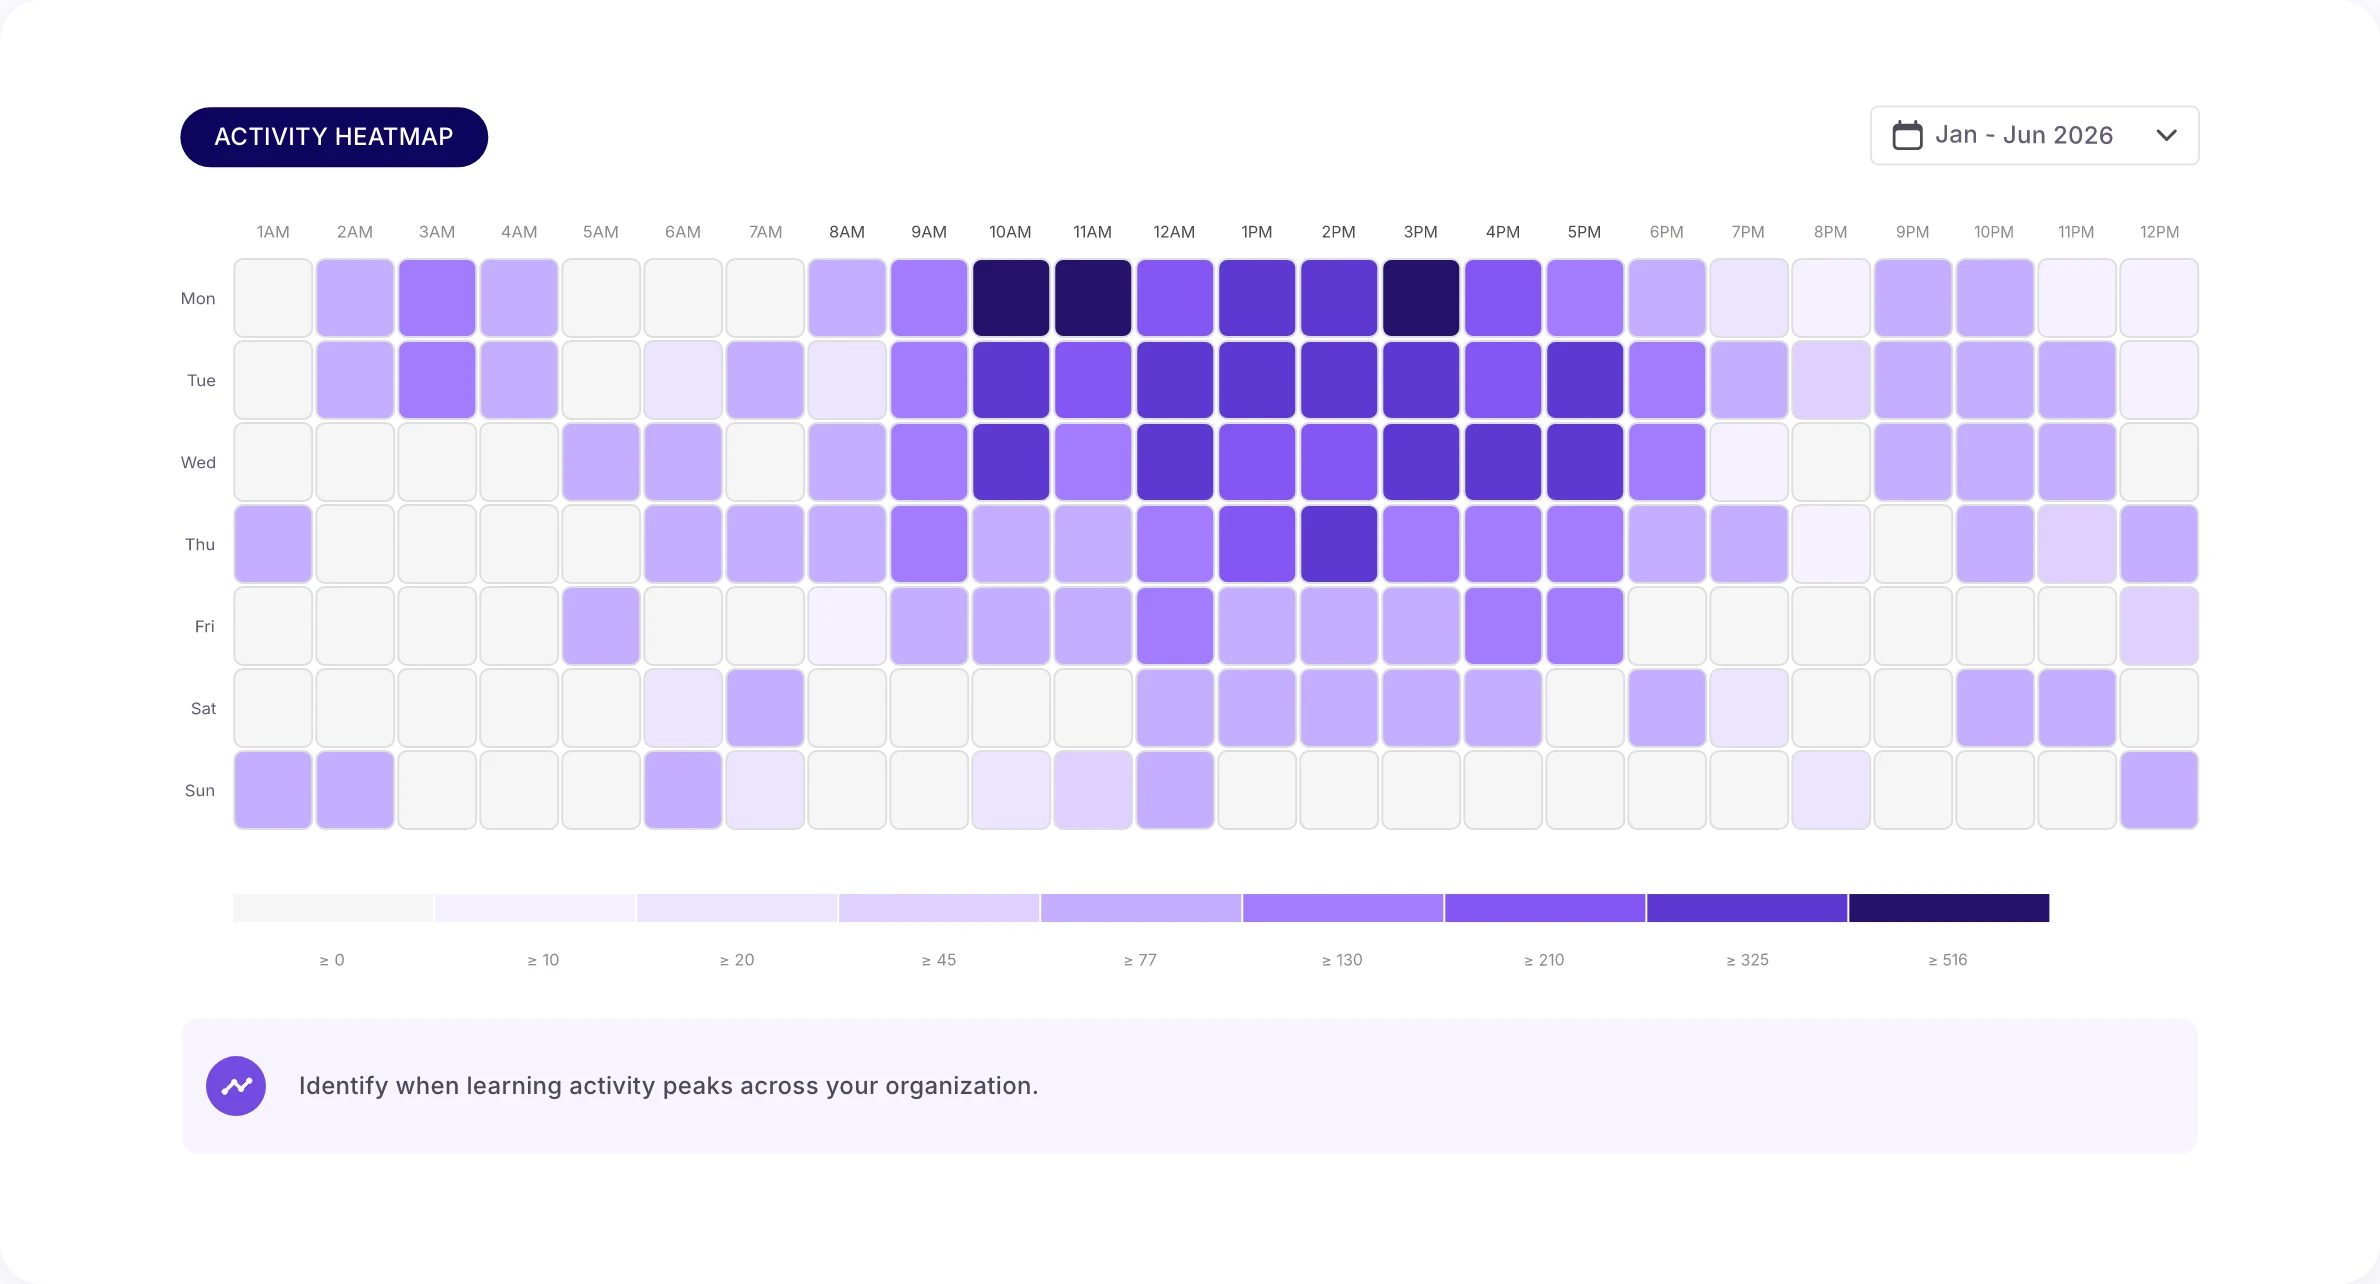
Understand the spread of knowledge across your team. Identify gaps before they become problems.
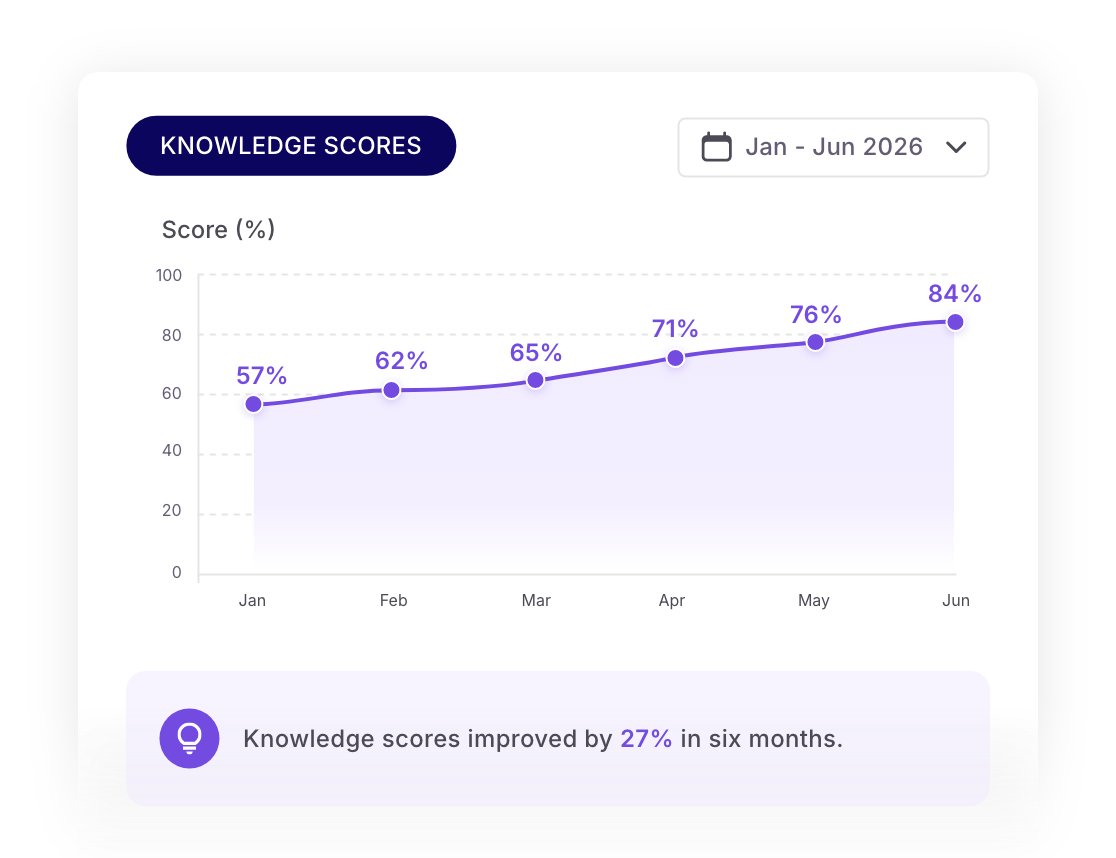
Track performance over time. Month-over-month improvement or decline, visualized.
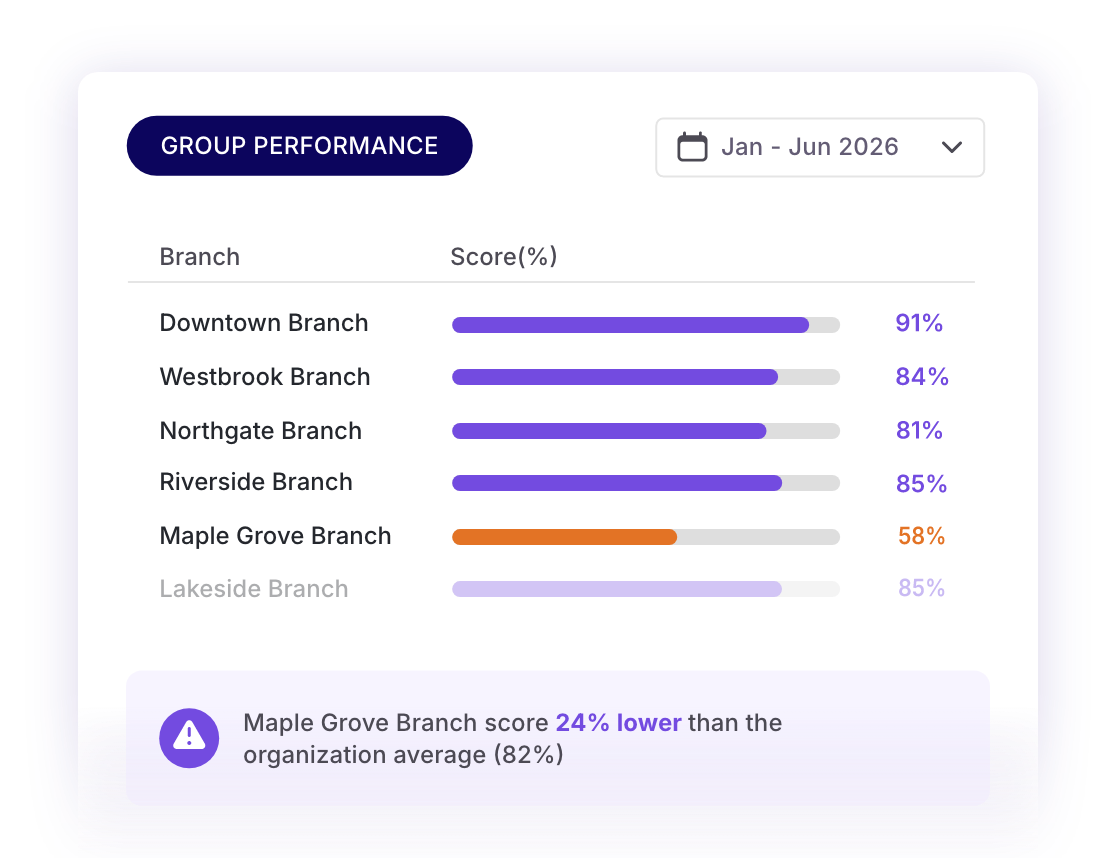
Compare performance across locations, departments, and roles. Spot inconsistencies.
Sync LemonadeLXP knowledge, retention, and behavior signals directly to Snowflake. Join them with the proprietary data you already trust — sales, NPS, error rates, retention — and prove that training is moving the needle.
 Knowledge Score
 30-Day Retention
 Training Completion
 At-Risk Learners
 NATIVE SYNC


Revenue lift in branches with knowledge scores above 80%.
Fewer compliance errors in teams with stronger training performance.
Higher NPS scores in teams with stronger learning retention.
Faster onboarding in teams with higher training completion rates.
(Thank to) the analytics, we saw a 25% increase in knowledge across the board. We’re seeing our frontline’s confidence grow, and that’s directly impacting the client experience.